
Ulta Beauty (ULTA) Stock
Fundamentals
Source: third-party data provider, as of October 12, 2026
Compare with ULTA
Recent news

These 2 Retail and Wholesale Stocks Could Beat Earnings: Why They Should Be on Your Radar
These 2 Retail and Wholesale Stocks Could Beat Earnings: Why They Should Be on Your Radar
ULTA
Ulta Beauty Raises 2026 Outlook as E-Commerce Momentum Accelerates
Ulta Beauty Raises 2026 Outlook as E-Commerce Momentum Accelerates
ULTA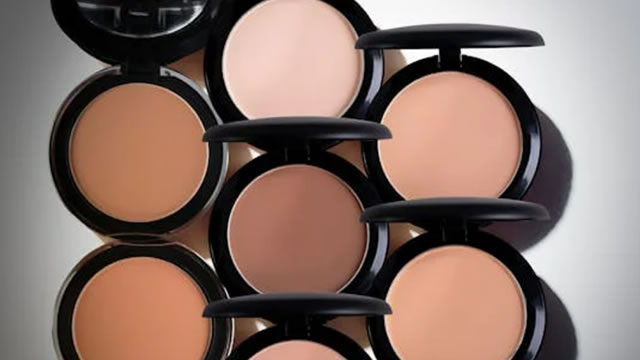
Is Ulta Beauty Worth Buying as Growth Meets a Midrange Valuation?
Is Ulta Beauty Worth Buying as Growth Meets a Midrange Valuation?
ULTA
Ulta Beauty Rises 20.7% in 3 Months: Can Its Rally Keep Going Now?
Ulta Beauty Rises 20.7% in 3 Months: Can Its Rally Keep Going Now?
ULTANews tone: automated (AI) classification of the article's content, not a price prediction.
Technical indicators
- RSI 14
- 63.26
- MACD 12/26/9
- 5.46
- EMA 9 of MACD
- 4.21
- MACD histogram
- 1.25
- SMA 50
- $540.31
- Price above SMA 50
- EMA 50
- $536.75
- Price above EMA 50
- SMA 200
- $554.62
- Price above SMA 200
- EMA 200
- $549.59
- Price above EMA 200
Calculated by Gotrade from daily closing prices, as of October 9, 2026. Technical data, not a recommendation.
Analyst ratings
Analyst consensus: Buy
Based on 9 analysts
Third-party analyst opinion, not a recommendation from Gotrade.
Financials
Performance
Debt & Balance Sheet
Revenue to Profit
2025Earnings
The market is expecting earnings per share of $6.25 for this quarter. The company has not yet shared when it is announcing earnings.
Source: third-party data provider
Latest news
These 2 Retail and Wholesale Stocks Could Beat Earnings: Why They Should Be on Your Radar
These 2 Retail and Wholesale Stocks Could Beat Earnings: Why They Should Be on Your Radar
ULTAUlta Beauty Raises 2026 Outlook as E-Commerce Momentum Accelerates
Ulta Beauty Raises 2026 Outlook as E-Commerce Momentum Accelerates
ULTAIs Ulta Beauty Worth Buying as Growth Meets a Midrange Valuation?
Is Ulta Beauty Worth Buying as Growth Meets a Midrange Valuation?
ULTAUlta Beauty Rises 20.7% in 3 Months: Can Its Rally Keep Going Now?
Ulta Beauty Rises 20.7% in 3 Months: Can Its Rally Keep Going Now?
ULTA
WOOF vs. ULTA: Which Stock Should Value Investors Buy Now?
WOOF vs. ULTA: Which Stock Should Value Investors Buy Now?
ULTA
Ulta Beauty CEO Kecia Steelman Sells 2,000 Shares for $1.1 Million
Ulta Beauty CEO Kecia Steelman Sells 2,000 Shares for $1.1 Million
ULTA
Beauty, health and wellness are converging into one retail category
Beauty, health and wellness are converging into one retail category
ULTA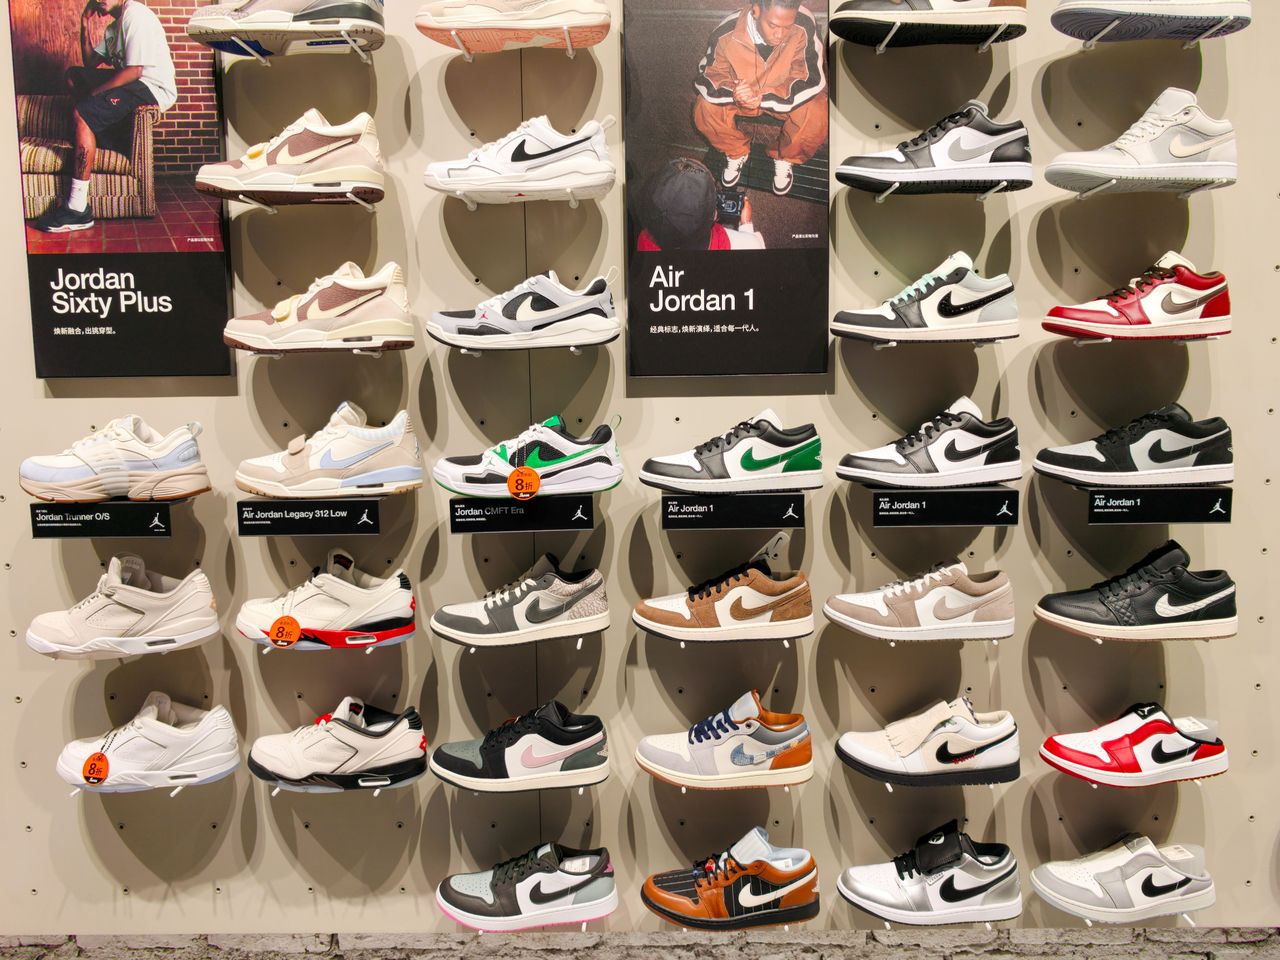
NKE, FLNC, CPRT, ULTA, JBHT: Top Wall Street Calls And Target Changes Making Waves This Week
NKE, FLNC, CPRT, ULTA, JBHT: Top Wall Street Calls And Target Changes Making Waves This Week
ULTA
Why Ulta Beauty (ULTA) is a Top Momentum Stock for the Long-Term
Why Ulta Beauty (ULTA) is a Top Momentum Stock for the Long-Term
ULTA
Ulta Beauty Sees Resilient Demand, Eyes Fragrance, Wellness Growth After Target Exit
Ulta Beauty Sees Resilient Demand, Eyes Fragrance, Wellness Growth After Target Exit
ULTANews tone: automated (AI) classification of the article's content, not a price prediction.
About Ulta Beauty
At Ulta Beauty, the possibilities are beautiful. Ulta Beauty is the largest U.S. beauty retailer and the premier beauty destination for cosmetics, fragrance, skin care products, hair care products and salon services. Today, Ulta Beauty has grown to become the top national retailer offering the complete beauty experience.
Key Executives
| Name | Title | Year Born |
|---|---|---|
| Ms. Kecia L. Steelman | President, CEO & Director | 1971 |
| Mr. Christopher J. DelOrefice CPA | CFO & Principal Financial Officer | 1971 |
| Mr. Christopher Lialios | Senior VP, Controller & Principal Accounting Officer | 1966 |
| Mr. Kelly E. Garcia | Chief Technology Officer | 1976 |
| Mr. Rene G. Casares | Chief Legal Officer & Corporate Secretary | — |
| Ms. Anita J. Ryan | Chief Human Resources Officer | 1964 |
| Ms. Kiley F. Rawlins CFA | Senior Vice President of Investor Relations | — |
Fundamentals
Valuation
Earnings Per Share
Income Statement
Dividend
Source: third-party data provider, as of October 12, 2026
Technical indicators
- RSI 14
- 63.26
- MACD 12/26/9
- 5.46
- EMA 9 of MACD
- 4.21
- MACD histogram
- 1.25
- SMA 50
- $540.31
- Price above SMA 50
- EMA 50
- $536.75
- Price above EMA 50
- SMA 200
- $554.62
- Price above SMA 200
- EMA 200
- $549.59
- Price above EMA 200
Calculated by Gotrade from daily closing prices, as of October 9, 2026. Technical data, not a recommendation.
Analyst views
9 analyst ratings
Third-party analyst opinion, not a recommendation from Gotrade.
- Low
- $525.00
- Average
- $630.78
- High
- $710.00
Seasonality
Monthly price change (%)| Jan | Feb | Mar | Apr | May | Jun | Jul | Aug | Sep | Oct | Nov | Dec | |
|---|---|---|---|---|---|---|---|---|---|---|---|---|
| 2021 | -7.1 | +5.2 | +11.4 | |||||||||
| 2022 | -12.0 | +0.6 | +7.9 | +2.2 | +4.3 | -5.4 | +1.6 | +6.5 | -5.4 | +3.6 | +10.2 | -0.7 |
| 2023 | +9.0 | -0.9 | +5.7 | +0.0 | -23.1 | +16.5 | -6.8 | -6.2 | -4.0 | -5.4 | +13.5 | +3.8 |
| 2024 | +3.2 | +8.9 | -4.9 | -23.5 | -1.7 | -1.0 | -5.1 | +0.8 | +8.5 | -2.7 | +2.4 | +10.4 |
| 2025 | -4.0 | -10.2 | +5.1 | +5.8 | +20.0 | -1.7 | +8.8 | -3.0 | +2.7 | -6.5 | +4.1 | +10.5 |
| 2026 | +4.4 | +2.9 | -22.8 | +0.2 | -4.3 | -9.9 | +12.8 | +0.5 | +0.1 | +6.1 |










