
Americas Gold and Silver Corporation (USAS) Stock
Key stats
- Market cap
- $1.22B
- Price / Earnings ratio
- -25.1x
- EPS (TTM)
- -$2.77
- Volume
- Loading
- 52-week high
- $10.50
- 52-week low
- $3.51
Source: third-party data provider, as of October 23, 2026
Compare with USAS
Recent news
New Strong Sell Stocks for October 20th
New Strong Sell Stocks for October 20th
USAS
Americas Gold and Silver Targets 5M Ounces as Galena Overhaul Gains Momentum
Americas Gold and Silver Targets 5M Ounces as Galena Overhaul Gains Momentum
USAS
BENEATH THE BOOM: China's rare earth edge raises HUGE question for US
BENEATH THE BOOM: China's rare earth edge raises HUGE question for US
USAS
Americas Gold and Silver Q2 Earnings Call Highlights
Americas Gold and Silver Q2 Earnings Call Highlights
USASNews tone: automated (AI) classification of the article's content, not a price prediction.
Technical indicators
- RSI 14
- 25.39
- MACD 12/26/9
- -0.36
- EMA 9 of MACD
- -0.29
- MACD histogram
- -0.07
- SMA 50
- $4.76
- Price below SMA 50
- EMA 50
- $4.48
- Price below EMA 50
- SMA 200
- $5.78
- Price below SMA 200
- EMA 200
- $5.31
- Price below EMA 200
Calculated by Gotrade from daily closing prices, as of October 22, 2026. Technical data, not a recommendation.
Analyst ratings
Analyst consensus: Buy
Based on 1 analyst rating
Third-party analyst opinion, not a recommendation from Gotrade.
Financials
Performance
No data available
Debt & Balance Sheet
No data available
Revenue to Profit
No data available
Earnings
No data available
Source: third-party data provider
Latest news
New Strong Sell Stocks for October 20th
New Strong Sell Stocks for October 20th
USASAmericas Gold and Silver Targets 5M Ounces as Galena Overhaul Gains Momentum
Americas Gold and Silver Targets 5M Ounces as Galena Overhaul Gains Momentum
USASBENEATH THE BOOM: China's rare earth edge raises HUGE question for US
BENEATH THE BOOM: China's rare earth edge raises HUGE question for US
USASAmericas Gold and Silver Q2 Earnings Call Highlights
Americas Gold and Silver Q2 Earnings Call Highlights
USAS
Royal Gold's Q2 Gold-Equivalent Ounces Sales Jump 8% Y/Y
Royal Gold's Q2 Gold-Equivalent Ounces Sales Jump 8% Y/Y
USAS
3 Gold Stocks Under $5 With Massive Upside
3 Gold Stocks Under $5 With Massive Upside
USAS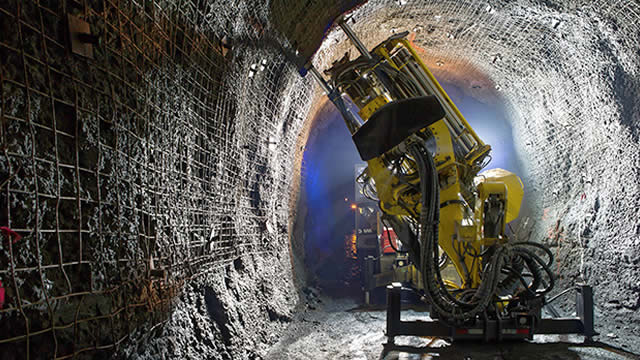
America's Gold and Silver (USAS) CEO on Metal "Buy Opportunity" Amid AI Race
America's Gold and Silver (USAS) CEO on Metal "Buy Opportunity" Amid AI Race
USAS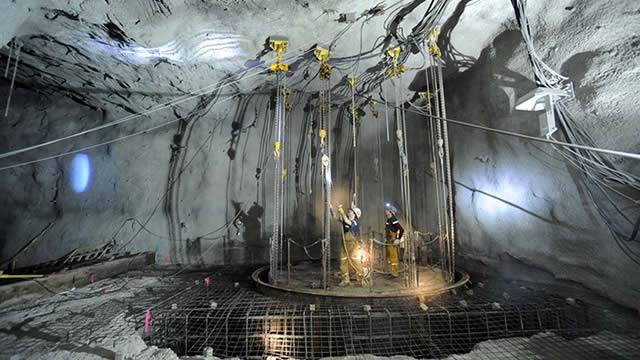
USAS Boosts Balance Sheet Strength With Gold Settlement Agreement
USAS Boosts Balance Sheet Strength With Gold Settlement Agreement
USAS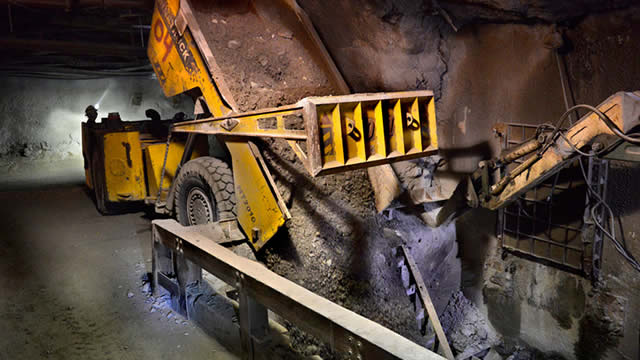
Americas Gold and Silver Q1 Earnings Call Highlights
Americas Gold and Silver Q1 Earnings Call Highlights
USAS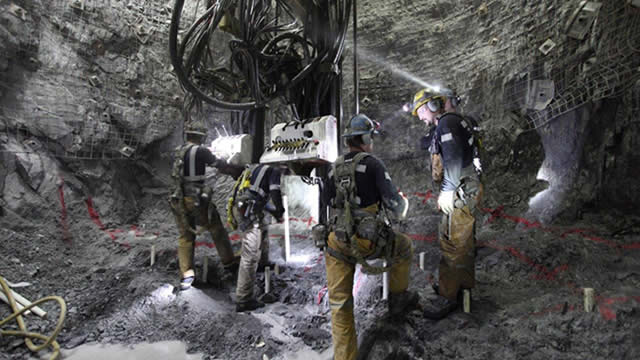
SECURITY WARNING: CEO SOUNDS ALARM on foreign reliance on critical minerals
SECURITY WARNING: CEO SOUNDS ALARM on foreign reliance on critical minerals
USASNews tone: automated (AI) classification of the article's content, not a price prediction.
About Americas Gold and Silver Corporation
No description available.
Key Executives
| Name | Title | Year Born |
|---|---|---|
| Mr. Joseph Paul Andre Huet Acc.Dir. | CEO & Chairman of the Board | 1969 |
| Mr. Warren Varga C.F.A. | Chief Financial Officer | 1970 |
| Mr. Michael Benjamin Doolin Acc.Dir | Chief Operating Officer | 1962 |
| Mr. Rob Buchanan | Vice President of Sustainability & Communications | — |
| Mr. James M. Stonehouse M.A. Geol. | Vice President of Exploration | 1953 |
| Mr. Oliver Turner | Executive VP of Corporate Development | 1987 |
Fundamentals
Valuation
Profitability
Trading
Source: third-party data provider, as of October 23, 2026
Technical indicators
- RSI 14
- 25.39
- MACD 12/26/9
- -0.36
- EMA 9 of MACD
- -0.29
- MACD histogram
- -0.07
- SMA 50
- $4.76
- Price below SMA 50
- EMA 50
- $4.48
- Price below EMA 50
- SMA 200
- $5.78
- Price below SMA 200
- EMA 200
- $5.31
- Price below EMA 200
Calculated by Gotrade from daily closing prices, as of October 22, 2026. Technical data, not a recommendation.
Analyst views
1 analyst rating
Third-party analyst opinion, not a recommendation from Gotrade.
- Low
- $9.25
- Average
- $9.25
- High
- $9.25
Seasonality
Monthly price change (%)| Jan | Feb | Mar | Apr | May | Jun | Jul | Aug | Sep | Oct | Nov | Dec | |
|---|---|---|---|---|---|---|---|---|---|---|---|---|
| 2021 | +2.2 | -11.8 | +3.6 | |||||||||
| 2022 | -8.3 | +34.2 | +0.4 | -19.4 | -13.1 | -6.5 | -13.3 | -21.8 | -11.2 | -1.6 | +0.9 | +11.8 |
| 2023 | +2.6 | -20.4 | -7.0 | +0.0 | -17.6 | -20.0 | +4.1 | +4.0 | -11.9 | -31.0 | -1.6 | -5.9 |
| 2024 | -11.3 | -13.3 | -3.5 | +16.7 | +36.5 | -27.7 | -1.6 | +5.1 | +32.8 | +41.5 | -11.1 | -6.0 |
| 2025 | +29.6 | -10.1 | +12.8 | +22.4 | +6.9 | +25.5 | +4.7 | +18.2 | +34.3 | +3.7 | +15.0 | +8.3 |
| 2026 | +45.2 | +39.7 | -48.0 | +2.3 | +4.9 | -24.5 | -19.4 | +31.3 | -13.7 | -18.2 |