Wendy's (WEN) Stock
Key stats
- Market cap
- $1.59B
- Price / Earnings ratio
- 16.5x
- EPS (TTM)
- $0.51
- Volume
- Loading
- 52-week high
- $9.45
- 52-week low
- $5.94
- Dividend yield
- 5.88%
- Dividend amount (latest)
- $0.07
- EPS vs analyst estimate
- +20.0%Q3 FY25 · $0.24 vs $0.20
Source: third-party data provider, as of November 13, 2026
EPS estimate: analyst consensus
Compare with WEN
Recent news
Wendy’s Rejects Trian Partners-Led Takeover Bid, Adopts Limited-Duration Rights Plan For ‘Fair And Equal Treatment’ Of Shareholders
Wendy’s Rejects Trian Partners-Led Takeover Bid, Adopts Limited-Duration Rights Plan For ‘Fair And Equal Treatment’ Of Shareholders
WEN
Dutch Bros vs. Wendy's: Which Restaurant Stock Is the Better Buy Now?
Dutch Bros vs. Wendy's: Which Restaurant Stock Is the Better Buy Now?
WEN
Where's the Beef? Trian-Led Buyout Proposal Values Wendy's at $1.4B, But Is It Enough?
Where's the Beef? Trian-Led Buyout Proposal Values Wendy's at $1.4B, But Is It Enough?
WEN
WEN vs. DRI: Which Stock Is the Better Value Option?
WEN vs. DRI: Which Stock Is the Better Value Option?
WENNews tone: automated (AI) classification of the article's content, not a price prediction.
Technical indicators
- RSI 14
- 76.20
- MACD 12/26/9
- 0.42
- EMA 9 of MACD
- 0.23
- MACD histogram
- 0.19
- SMA 50
- $6.96
- Price above SMA 50
- EMA 50
- $7.18
- Price above EMA 50
- SMA 200
- $7.35
- Price above SMA 200
- EMA 200
- $7.41
- Price above EMA 200
Calculated by Gotrade from daily closing prices, as of November 11, 2026. Technical data, not a recommendation.
Analyst ratings
Analyst consensus: Hold
Based on 8 analyst ratings
Third-party analyst opinion, not a recommendation from Gotrade.
Financials
Performance
Debt & Balance Sheet
Revenue to Profit
2025Earnings
The market is expecting earnings per share of $0.23 for this quarter. The company has not yet shared when it is announcing earnings.
Source: third-party data provider
Latest news
Wendy’s Rejects Trian Partners-Led Takeover Bid, Adopts Limited-Duration Rights Plan For ‘Fair And Equal Treatment’ Of Shareholders
Wendy’s Rejects Trian Partners-Led Takeover Bid, Adopts Limited-Duration Rights Plan For ‘Fair And Equal Treatment’ Of Shareholders
WENDutch Bros vs. Wendy's: Which Restaurant Stock Is the Better Buy Now?
Dutch Bros vs. Wendy's: Which Restaurant Stock Is the Better Buy Now?
WENWhere's the Beef? Trian-Led Buyout Proposal Values Wendy's at $1.4B, But Is It Enough?
Where's the Beef? Trian-Led Buyout Proposal Values Wendy's at $1.4B, But Is It Enough?
WENWEN vs. DRI: Which Stock Is the Better Value Option?
WEN vs. DRI: Which Stock Is the Better Value Option?
WEN
Wendy's (WEN) Surges 15.2%: Is This an Indication of Further Gains?
Wendy's (WEN) Surges 15.2%: Is This an Indication of Further Gains?
WEN
Analysts Estimate Wendy's (WEN) to Report a Decline in Earnings: What to Look Out for
Analysts Estimate Wendy's (WEN) to Report a Decline in Earnings: What to Look Out for
WEN
Is Wendy's (WEN) Stock Undervalued Right Now?
Is Wendy's (WEN) Stock Undervalued Right Now?
WEN
Wendy's Gets a Lifeline, but Kohl's May Be the Smarter Buyout Bet
Wendy's Gets a Lifeline, but Kohl's May Be the Smarter Buyout Bet
WEN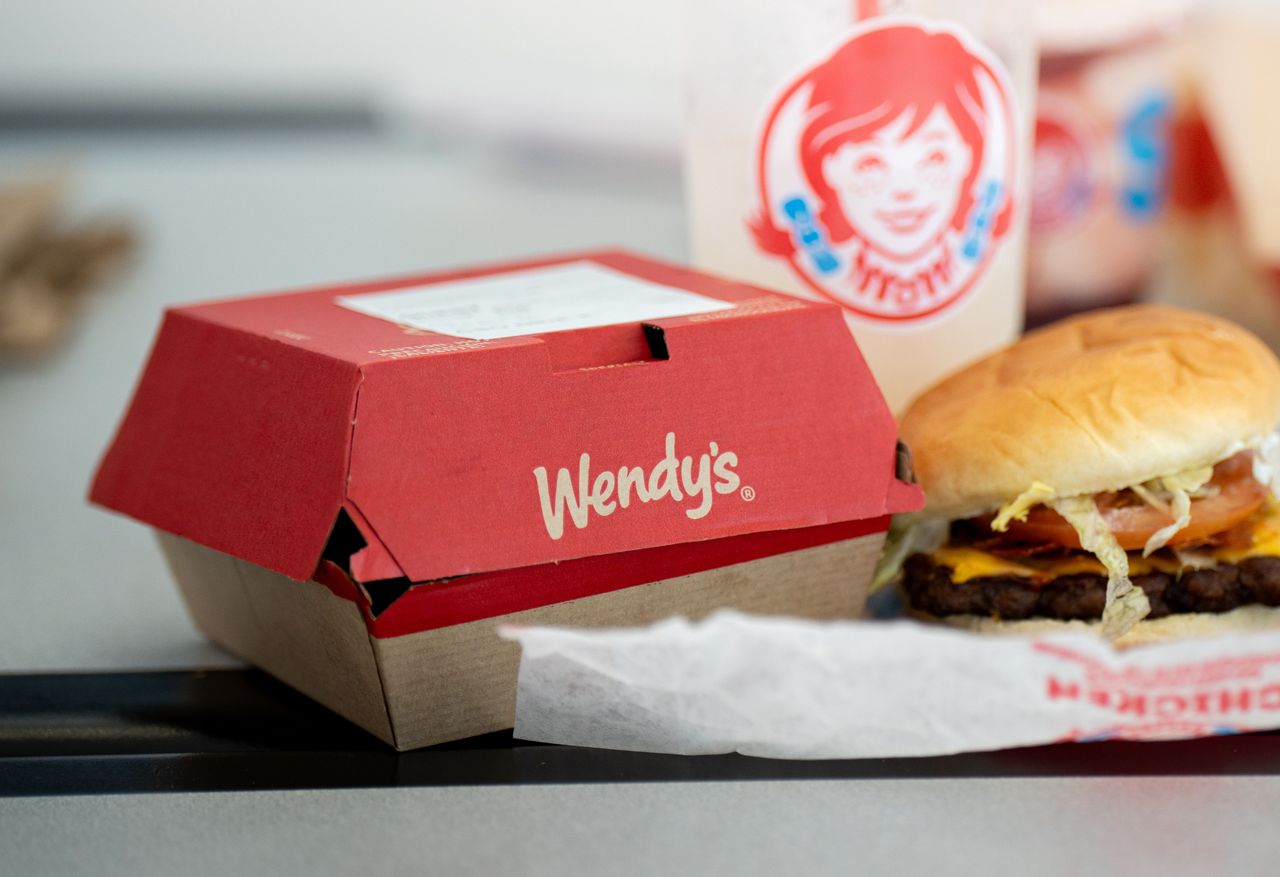
WEN Stock Heads For Best Week Since June: Wendy's To Assess Peltz's $1.4B Bid, Retail Expects 'More Offers To Come'
WEN Stock Heads For Best Week Since June: Wendy's To Assess Peltz's $1.4B Bid, Retail Expects 'More Offers To Come'
WEN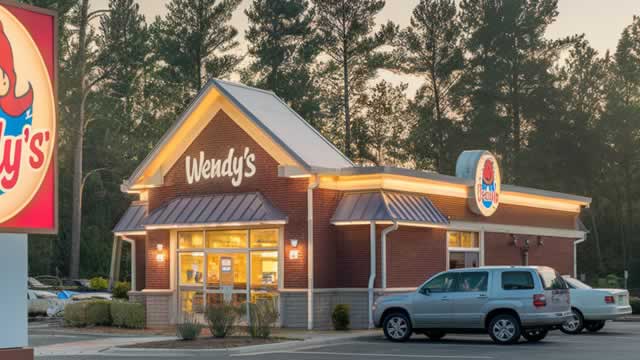
Why Wendy's Rallied Big on Wednesday
Why Wendy's Rallied Big on Wednesday
WENNews tone: automated (AI) classification of the article's content, not a price prediction.
About Wendy's
Wendy's® was founded in 1969 by Dave Thomas in Columbus, Ohio. Dave built his business on the premise, "Quality is our Recipe®," which remains the guidepost of the Wendy's system. Wendy's is best known for its made-to-order square hamburgers, using fresh, never frozen beef, freshly-prepared salads, and other signature items like chili, baked potatoes and the Frosty® dessert. The Wendy's Company is committed to doing the right thing and making a positive difference in the lives of others. This is most visible through the Company's support of the Dave Thomas Foundation for Adoption® and its signature Wendy's Wonderful Kids® program, which seeks to find a loving, forever home for every child waiting to be adopted from the North American foster care system.
Key Executives
| Name | Title | Year Born |
|---|---|---|
| Mr. Robert D. Wright | President, CEO & Director | 1967 |
| Mr. Steven W. Cirulis | Chief Financial Officer & Chief Strategy Officer | 1971 |
| Mr. John K. Min | Chief Legal Officer & Secretary | 1980 |
| Mr. Eric J. Wunsch Esq. | President of International | 1971 |
| Mr. Aaron M. Kale | Chief Accounting Officer, Principal Accounting Officer & VP of Tax | 1977 |
| Mr. Matthew P. Spessard | Chief Information Officer | 1983 |
| Mr. Aaron Broholm | Head of Investor Relations | — |
| Ms. Heidi S. Schauer | Vice President of Communications, Public Affairs & Customer Care | — |
| Mr. Tariq H. Hassan | Chief Marketing & Customer Growth Officer | 1970 |
| Ms. Liliana M. Esposito | Chief Corporate Affairs & Sustainability Officer | 1975 |
Fundamentals
Valuation
Profitability
Trading
Dividend
Source: third-party data provider, as of November 13, 2026
Technical indicators
- RSI 14
- 76.20
- MACD 12/26/9
- 0.42
- EMA 9 of MACD
- 0.23
- MACD histogram
- 0.19
- SMA 50
- $6.96
- Price above SMA 50
- EMA 50
- $7.18
- Price above EMA 50
- SMA 200
- $7.35
- Price above SMA 200
- EMA 200
- $7.41
- Price above EMA 200
Calculated by Gotrade from daily closing prices, as of November 11, 2026. Technical data, not a recommendation.
Analyst views
8 analyst ratings
Third-party analyst opinion, not a recommendation from Gotrade.
- Low
- $6.00
- Average
- $7.25
- High
- $8.00
Seasonality
Monthly price change (%)| Jan | Feb | Mar | Apr | May | Jun | Jul | Aug | Sep | Oct | Nov | Dec | |
|---|---|---|---|---|---|---|---|---|---|---|---|---|
| 2021 | -6.2 | +17.0 | ||||||||||
| 2022 | -3.6 | -1.8 | -3.3 | -8.9 | -4.6 | +1.8 | +8.6 | -9.6 | -3.7 | +9.7 | +8.4 | -0.3 |
| 2023 | +1.4 | -1.6 | -1.9 | -0.8 | -0.8 | -3.9 | -1.4 | -7.5 | +2.4 | -5.1 | -1.3 | -0.3 |
| 2024 | -1.4 | -6.1 | +4.6 | +7.5 | -11.1 | -2.1 | +3.0 | -0.2 | +6.3 | +8.2 | -6.6 | -9.7 |
| 2025 | -8.0 | +3.1 | -2.0 | -15.1 | -8.7 | -1.4 | -17.1 | +6.5 | -10.8 | -9.7 | +0.2 | +1.2 |
| 2026 | -4.7 | -0.4 | -6.6 | +0.9 | +14.9 | +5.6 | -17.7 | +10.2 | -22.9 | +15.4 | +14.9 |