Wheaton Precious Metals (WPM) Stock
Key stats
- Market cap
- $59.72B
- Price / Earnings ratio
- 26.0x
- EPS (TTM)
- $4.52
- Volume
- Loading
- 52-week high
- $165.76
- 52-week low
- $94.28
- Dividend yield
- 0.57%
- Dividend amount (latest)
- $0.20
- EPS vs analyst estimate
- +4.9%Q3 FY25 · $0.62 vs $0.59
- Next earnings report
- 5 Nov 2026
Source: third-party data provider, as of November 5, 2026
EPS estimate: analyst consensus
Compare with WPM
Recent news
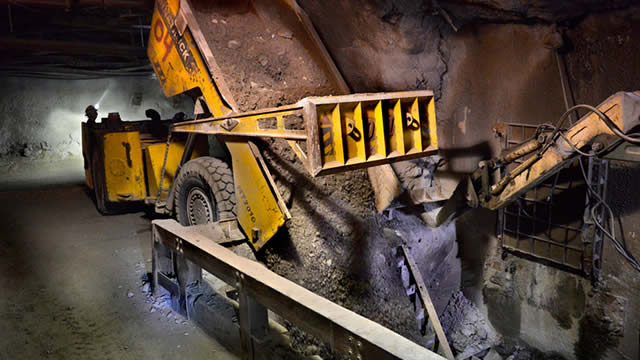
Wheaton Precious Metals Set to Report Q3 Earnings: What's in Store?
Wheaton Precious Metals Set to Report Q3 Earnings: What's in Store?
WPM
TECK vs. WPM: Which Stock Is the Better Value Option?
TECK vs. WPM: Which Stock Is the Better Value Option?
WPM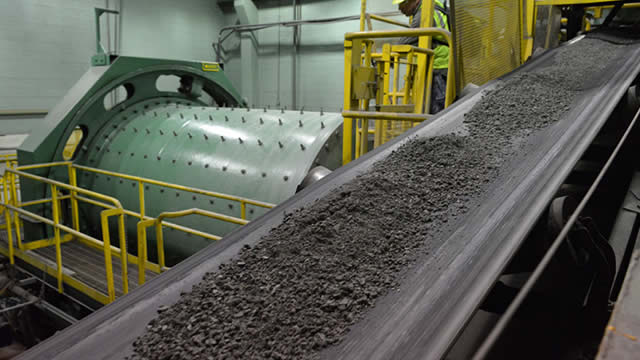
Wheaton Precious Metals Corp. (WPM) Earnings Expected to Grow: What to Know Ahead of Next Week's Release
Wheaton Precious Metals Corp. (WPM) Earnings Expected to Grow: What to Know Ahead of Next Week's Release
WPM
TECK vs. WPM: Which Stock Should Value Investors Buy Now?
TECK vs. WPM: Which Stock Should Value Investors Buy Now?
WPMNews tone: automated (AI) classification of the article's content, not a price prediction.
Technical indicators
- RSI 14
- 51.83
- MACD 12/26/9
- -4.48
- EMA 9 of MACD
- -4.63
- MACD histogram
- 0.15
- SMA 50
- $139.50
- Price below SMA 50
- EMA 50
- $132.68
- Price below EMA 50
- SMA 200
- $133.63
- Price below SMA 200
- EMA 200
- $131.53
- Price below EMA 200
Calculated by Gotrade from daily closing prices, as of November 4, 2026. Technical data, not a recommendation.
Analyst ratings
Analyst consensus: Buy
Based on 2 analyst ratings
Third-party analyst opinion, not a recommendation from Gotrade.
Financials
Performance
Debt & Balance Sheet
Revenue to Profit
2025Earnings
The market is expecting earnings per share of $0.85 for this quarter. The company has not yet shared when it is announcing earnings.
Source: third-party data provider
Latest news
Wheaton Precious Metals Set to Report Q3 Earnings: What's in Store?
Wheaton Precious Metals Set to Report Q3 Earnings: What's in Store?
WPMTECK vs. WPM: Which Stock Is the Better Value Option?
TECK vs. WPM: Which Stock Is the Better Value Option?
WPMWheaton Precious Metals Corp. (WPM) Earnings Expected to Grow: What to Know Ahead of Next Week's Release
Wheaton Precious Metals Corp. (WPM) Earnings Expected to Grow: What to Know Ahead of Next Week's Release
WPMTECK vs. WPM: Which Stock Should Value Investors Buy Now?
TECK vs. WPM: Which Stock Should Value Investors Buy Now?
WPM
Will Wheaton Precious Metals' Development Assets Drive Growth?
Will Wheaton Precious Metals' Development Assets Drive Growth?
WPM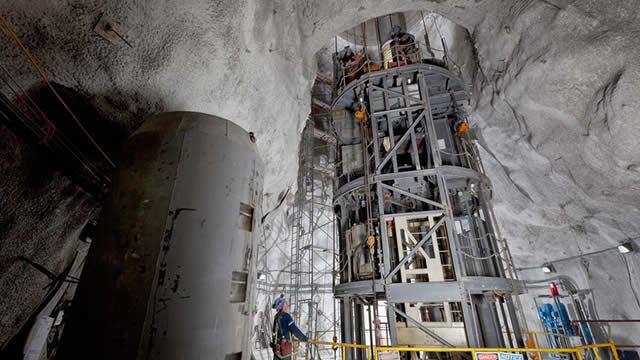
Will Wheaton Precious Metals (WPM) Beat Estimates Again in Its Next Earnings Report?
Will Wheaton Precious Metals (WPM) Beat Estimates Again in Its Next Earnings Report?
WPM
America's $6 Trillion Interest-Rate Trap Is Spreading Far Beyond the Bond Market — and Investors Are Taking Notice
America's $6 Trillion Interest-Rate Trap Is Spreading Far Beyond the Bond Market — and Investors Are Taking Notice
WPM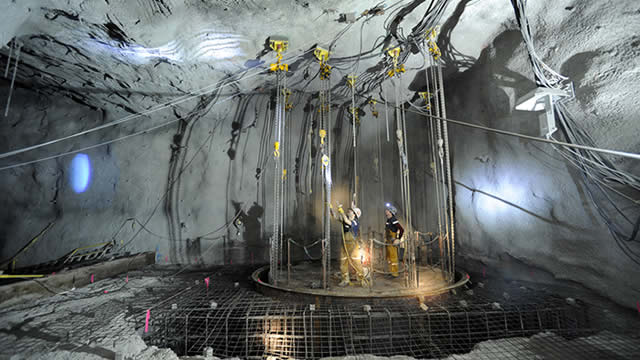
Wheaton Precious Metals Eyes 1.2M Ounces by 2030 as Deal Pipeline Expands
Wheaton Precious Metals Eyes 1.2M Ounces by 2030 as Deal Pipeline Expands
WPM
RS or WPM: Which Is the Better Value Stock Right Now?
RS or WPM: Which Is the Better Value Stock Right Now?
WPM
Gold Defied the Fed's Rate Hike—These 3 Plays Stand Out
Gold Defied the Fed's Rate Hike—These 3 Plays Stand Out
WPMNews tone: automated (AI) classification of the article's content, not a price prediction.
About Wheaton Precious Metals
Wheaton is the world's premier precious metals streaming company with the highest-quality portfolio of long-life, low-cost assets. Its business model offers investors commodity price leverage and exploration upside but with a much lower risk profile than a traditional mining company. Wheaton delivers amongst the highest cash operating margins in the mining industry, allowing it to pay a competitive dividend and continue to grow through accretive acquisitions. As a result, Wheaton has consistently outperformed gold and silver, as well as other mining investments. Wheaton creates sustainable value through streaming.
Key Executives
| Name | Title | Year Born |
|---|---|---|
| Mr. Haytham Henry Hodaly | President, CEO & Director | — |
| Mr. Vincent Lau | Senior VP & CFO | — |
| Mr. Curt Domenico Bernardi LLB | Executive VP of Strategy & General Counsel | 1968 |
| Mr. Patrick Eugene Drouin | President of Wheaton International & Chief Sustainability Officer | — |
| Mr. G. Wesley Carson P.Eng, P.Eng. | Vice President of Operations | — |
| Mr. Ryan Ulansky M.A.Sc., P.Eng | Vice President of Technical Services | — |
| Ms. Emma Murray | Vice President of Investor Relations | — |
| Ms. Simona Antolak | Vice President of Communications & Corporate Affairs | — |
| Mr. Neil Burns M.Sc., P.Geo. | Vice President of Corporate Development | — |
| Ms. Tamara Howarth | Vice President of Legal & People | — |
Fundamentals
Valuation
Profitability
Trading
Dividend
Source: third-party data provider, as of November 5, 2026
Technical indicators
- RSI 14
- 51.83
- MACD 12/26/9
- -4.48
- EMA 9 of MACD
- -4.63
- MACD histogram
- 0.15
- SMA 50
- $139.50
- Price below SMA 50
- EMA 50
- $132.68
- Price below EMA 50
- SMA 200
- $133.63
- Price below SMA 200
- EMA 200
- $131.53
- Price below EMA 200
Calculated by Gotrade from daily closing prices, as of November 4, 2026. Technical data, not a recommendation.
Analyst views
2 analyst ratings
Third-party analyst opinion, not a recommendation from Gotrade.
- Low
- $160.00
- Average
- $162.50
- High
- $165.00
Seasonality
Monthly price change (%)| Jan | Feb | Mar | Apr | May | Jun | Jul | Aug | Sep | Oct | Nov | Dec | |
|---|---|---|---|---|---|---|---|---|---|---|---|---|
| 2021 | +1.1 | +5.9 | ||||||||||
| 2022 | -3.6 | +7.8 | +3.8 | -8.2 | -6.6 | -12.9 | -7.5 | -10.9 | +8.7 | -2.8 | +18.3 | -2.6 |
| 2023 | +12.7 | -9.0 | +15.7 | +0.4 | -7.5 | -6.5 | +2.0 | -0.5 | -6.1 | +8.5 | +13.5 | -0.4 |
| 2024 | -3.2 | -14.3 | +12.3 | +9.1 | +4.0 | -4.8 | +14.8 | +5.7 | +2.3 | +7.9 | -4.3 | -8.5 |
| 2025 | +7.6 | +8.4 | +12.9 | +8.7 | +7.0 | -2.2 | +2.4 | +9.0 | +10.1 | -13.4 | +13.2 | +6.9 |
| 2026 | +11.9 | +23.8 | -20.9 | -7.6 | +5.4 | -12.8 | -2.2 | +34.8 | -7.7 | -12.6 | +10.4 |
Corporate actions
Upcoming
No upcoming corporate actions for WPM