D.R. Horton (DHI) Stock
Key stats
- Market cap
- $40.98B
- Price / Earnings ratio
- 13.1x
- EPS (TTM)
- $10.54
- Volume
- Loading
- 52-week high
- $170.79
- 52-week low
- $130.40
- Dividend yield
- 1.23%
- Dividend amount (latest)
- $0.45
- EPS vs analyst estimate
- -7.6%Q4 FY25 · $3.04 vs $3.29
Source: third-party data provider, as of October 31, 2026
EPS estimate: analyst consensus
Compare with DHI
Recent news

D.R. Horton's Q4 Earnings Miss on Weak Housing Demand, Sales Beat
D.R. Horton's Q4 Earnings Miss on Weak Housing Demand, Sales Beat
DHI
D.R. Horton (DHI) Q4 Earnings: Taking a Look at Key Metrics Versus Estimates
D.R. Horton (DHI) Q4 Earnings: Taking a Look at Key Metrics Versus Estimates
DHI
D.R. Horton (DHI) Misses Q4 Earnings Estimates
D.R. Horton (DHI) Misses Q4 Earnings Estimates
DHI
D.R. Horton, Inc., America's Builder, Reports Fourth Quarter and Fiscal 2026 Earnings and Increases Quarterly Dividend to $0.50 Per Share
D.R. Horton, Inc., America's Builder, Reports Fourth Quarter and Fiscal 2026 Earnings and Increases Quarterly Dividend to $0.50 Per Share
DHINews tone: automated (AI) classification of the article's content, not a price prediction.
Technical indicators
- RSI 14
- 58.19
- MACD 12/26/9
- 1.77
- EMA 9 of MACD
- 0.62
- MACD histogram
- 1.16
- SMA 50
- $140.84
- Price above SMA 50
- EMA 50
- $141.69
- Price above EMA 50
- SMA 200
- $147.65
- Price below SMA 200
- EMA 200
- $146.17
- Price above EMA 200
Calculated by Gotrade from daily closing prices, as of October 29, 2026. Technical data, not a recommendation.
Analyst ratings
Analyst consensus: Hold
Based on 9 analyst ratings
Third-party analyst opinion, not a recommendation from Gotrade.
Financials
Performance
Debt & Balance Sheet
Revenue to Profit
2025Earnings
The market is expecting earnings per share of $3.58 for this quarter. The company has not yet shared when it is announcing earnings.
Source: third-party data provider
Latest news
D.R. Horton's Q4 Earnings Miss on Weak Housing Demand, Sales Beat
D.R. Horton's Q4 Earnings Miss on Weak Housing Demand, Sales Beat
DHID.R. Horton (DHI) Q4 Earnings: Taking a Look at Key Metrics Versus Estimates
D.R. Horton (DHI) Q4 Earnings: Taking a Look at Key Metrics Versus Estimates
DHID.R. Horton (DHI) Misses Q4 Earnings Estimates
D.R. Horton (DHI) Misses Q4 Earnings Estimates
DHID.R. Horton, Inc., America's Builder, Reports Fourth Quarter and Fiscal 2026 Earnings and Increases Quarterly Dividend to $0.50 Per Share
D.R. Horton, Inc., America's Builder, Reports Fourth Quarter and Fiscal 2026 Earnings and Increases Quarterly Dividend to $0.50 Per Share
DHI
What's in Store For These 5 Construction Stocks This Earnings Season?
What's in Store For These 5 Construction Stocks This Earnings Season?
DHI
Seeking Clues to D.R. Horton (DHI) Q4 Earnings?
Seeking Clues to D.R. Horton (DHI) Q4 Earnings?
DHI
Builders Are Slashing Prices at a Record Pace as the Housing Market Freezes
Builders Are Slashing Prices at a Record Pace as the Housing Market Freezes
DHI
D.R. Horton's Q4 Earnings Preview: What Investors Must Know Now?
D.R. Horton's Q4 Earnings Preview: What Investors Must Know Now?
DHI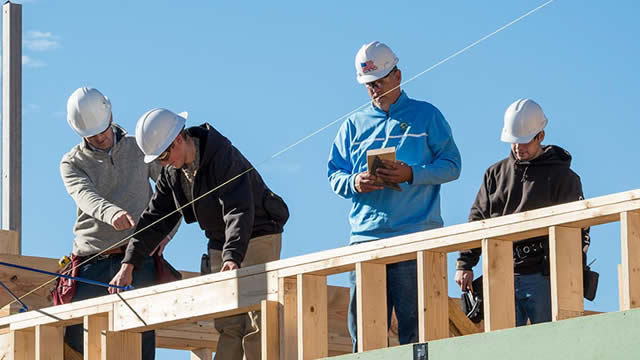
Analysts Estimate D.R. Horton (DHI) to Report a Decline in Earnings: What to Look Out for
Analysts Estimate D.R. Horton (DHI) to Report a Decline in Earnings: What to Look Out for
DHI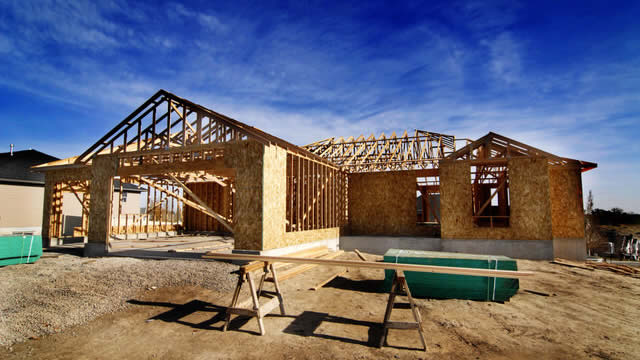
1970s Mortgage Rates Were Much Higher Than Today's 7.4%, And The Housing Market Still Boomed. So Why Is It Frozen Now?
1970s Mortgage Rates Were Much Higher Than Today's 7.4%, And The Housing Market Still Boomed. So Why Is It Frozen Now?
DHINews tone: automated (AI) classification of the article's content, not a price prediction.
About D.R. Horton
D.R. Horton, Inc. operates as a national homebuilder that engages in the construction and sale of single-family housing. It operates through the Homebuilding and Financial Services segments. The Homebuilding segment includes the sub-segments East, Midwest, Southeast, South Central, Southwest and West regions. The Financial Services segment provides mortgage financing and title agency services to homebuyers in many of its homebuilding markets.
Key Executives
| Name | Title | Year Born |
|---|---|---|
| Mr. Paul J. Romanowski | President, CEO & Director | 1971 |
| Mr. David V. Auld | Executive Chairman | 1956 |
| Mr. Bill W. Wheat | Executive VP & CFO | 1966 |
| Mr. Michael J. Murray | Executive VP & COO | 1966 |
| Mr. Aron M. Odom | Senior VP & Corporate Controller | 1974 |
| Collin Michael Dawson | Vice President of Corporate Finance & Treasurer | — |
| Ms. Jessica Leigh Hansen | Senior VP of Communications & People and Head of Investor Relations | — |
| Mr. Thomas B. Montano | Senior VP, Corporate Compliance Officer & Corporate Secretary | — |
| Mr. Rick Horton | President of South Region | — |
| Matt Farris | President of West Region | — |
Fundamentals
Valuation
Profitability
Trading
Dividend
Source: third-party data provider, as of October 31, 2026
Technical indicators
- RSI 14
- 58.19
- MACD 12/26/9
- 1.77
- EMA 9 of MACD
- 0.62
- MACD histogram
- 1.16
- SMA 50
- $140.84
- Price above SMA 50
- EMA 50
- $141.69
- Price above EMA 50
- SMA 200
- $147.65
- Price below SMA 200
- EMA 200
- $146.17
- Price above EMA 200
Calculated by Gotrade from daily closing prices, as of October 29, 2026. Technical data, not a recommendation.
Analyst views
9 analyst ratings
Third-party analyst opinion, not a recommendation from Gotrade.
- Low
- $119.00
- Average
- $144.50
- High
- $166.00
Seasonality
Monthly price change (%)| Jan | Feb | Mar | Apr | May | Jun | Jul | Aug | Sep | Oct | Nov | Dec | |
|---|---|---|---|---|---|---|---|---|---|---|---|---|
| 2021 | +8.2 | +10.9 | ||||||||||
| 2022 | -15.2 | -4.5 | -13.2 | -8.7 | +6.2 | -11.8 | +11.3 | -9.1 | -5.6 | +8.7 | +11.2 | +2.8 |
| 2023 | +8.8 | -7.4 | +7.5 | +11.9 | -1.5 | +12.2 | +5.7 | -7.0 | -10.6 | -1.7 | +16.8 | +16.1 |
| 2024 | -4.7 | +1.4 | +7.6 | -12.0 | +3.7 | -4.1 | +31.3 | +5.4 | +3.4 | -12.3 | +0.7 | -16.5 |
| 2025 | +3.1 | -7.7 | +1.2 | -0.8 | -6.0 | +10.3 | +6.7 | +12.8 | -0.5 | -13.5 | +9.6 | -8.5 |
| 2026 | +2.1 | +7.1 | -11.1 | +11.3 | -1.9 | +10.8 | -8.9 | -1.4 | -3.3 | +6.9 |