
Installed Building Products Inc (IBP) Stock
Key stats
- Market cap
- $5.57B
- Price / Earnings ratio
- 24.0x
- EPS (TTM)
- $8.83
- Volume
- Loading
- 52-week high
- $349.00
- 52-week low
- $176.15
- Dividend yield
- 1.59%
- Dividend amount (latest)
- $0.39
Source: third-party data provider, as of November 13, 2026
Compare with IBP
Recent news

Analysts Estimate Installed Building Products (IBP) to Report a Decline in Earnings: What to Look Out for
Analysts Estimate Installed Building Products (IBP) to Report a Decline in Earnings: What to Look Out for
IBP
Installed Building Products Successfully Closes Incremental Term Loan B Facility
Installed Building Products Successfully Closes Incremental Term Loan B Facility
IBP
Installed Building Products to Report Third Quarter 2026 Financial Results
Installed Building Products to Report Third Quarter 2026 Financial Results
IBP
Installed Building Products to Increase Existing Term Loan B Facility
Installed Building Products to Increase Existing Term Loan B Facility
IBPNews tone: automated (AI) classification of the article's content, not a price prediction.
Technical indicators
- RSI 14
- 50.94
- MACD 12/26/9
- 5.34
- EMA 9 of MACD
- 4.36
- MACD histogram
- 0.98
- SMA 50
- $202.99
- Price above SMA 50
- EMA 50
- $208.76
- Price above EMA 50
- SMA 200
- $243.97
- Price below SMA 200
- EMA 200
- $238.53
- Price below EMA 200
Calculated by Gotrade from daily closing prices, as of November 11, 2026. Technical data, not a recommendation.
Analyst ratings
Analyst consensus: Hold
Based on 7 analyst ratings
Third-party analyst opinion, not a recommendation from Gotrade.
Financials
Performance
Debt & Balance Sheet
Revenue to Profit
2025Earnings
No data available
Source: third-party data provider
Latest news
Analysts Estimate Installed Building Products (IBP) to Report a Decline in Earnings: What to Look Out for
Analysts Estimate Installed Building Products (IBP) to Report a Decline in Earnings: What to Look Out for
IBPInstalled Building Products Successfully Closes Incremental Term Loan B Facility
Installed Building Products Successfully Closes Incremental Term Loan B Facility
IBPInstalled Building Products to Report Third Quarter 2026 Financial Results
Installed Building Products to Report Third Quarter 2026 Financial Results
IBPInstalled Building Products to Increase Existing Term Loan B Facility
Installed Building Products to Increase Existing Term Loan B Facility
IBP
Installed Building Products Publishes 2026 Environmental, Social and Governance Report
Installed Building Products Publishes 2026 Environmental, Social and Governance Report
IBP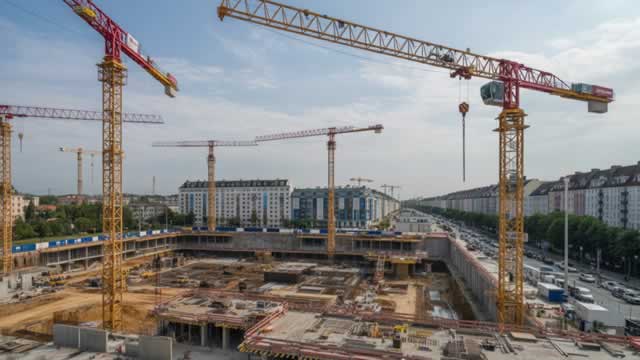
OC vs. IBP: Which Stock Should Value Investors Buy Now?
OC vs. IBP: Which Stock Should Value Investors Buy Now?
IBP
Down 18.6% in 4 Weeks, Here's Why Installed Building Products (IBP) Looks Ripe for a Turnaround
Down 18.6% in 4 Weeks, Here's Why Installed Building Products (IBP) Looks Ripe for a Turnaround
IBP
Down 20.1% in 4 Weeks, Here's Why Installed Building Products (IBP) Looks Ripe for a Turnaround
Down 20.1% in 4 Weeks, Here's Why Installed Building Products (IBP) Looks Ripe for a Turnaround
IBP
OC or IBP: Which Is the Better Value Stock Right Now?
OC or IBP: Which Is the Better Value Stock Right Now?
IBP
OC vs. IBP: Which Stock Is the Better Value Option?
OC vs. IBP: Which Stock Is the Better Value Option?
IBPNews tone: automated (AI) classification of the article's content, not a price prediction.
About Installed Building Products Inc
Installed Building Products, Inc. is a holding company. The Company is a residential insulation installer in the United States. It operates The Company offers its portfolio of services for new and existing single-family and multi-family residential and commercial building projects from its national network of approximately 175 branch locations. The Company also installs complementary building products, including garage doors, rain gutters, shower doors, closet shelving and mirrors, which provides cross-selling opportunities to supplement the insulation installation business. It also provides roof installation services. The Company manages various aspects of the installation process for the customers, from the direct purchase and receipt of materials from national manufacturers, to supply of materials to job sites and quality installation. The Company's customers include production and custom homebuilders, multi-family and commercial contractors, and homeowners.
Key Executives
| Name | Title | Year Born |
|---|---|---|
| Mr. Jeffrey W. Edwards | Chairman, CEO & President | 1964 |
| Mr. Michael Thomas Miller | CFO, Executive VP of Finance & Director | 1964 |
| Mr. Brad A. Wheeler | Chief Operating Officer | 1975 |
| Mr. Jason R. Niswonger | Chief Administrative & Sustainability Officer | 1973 |
| Mr. William Jeffrey Hire | President of External Affairs | 1951 |
| Mr. Todd R. Fry CPA | Chief Accounting Officer & Treasurer | 1966 |
| Mr. Martin J. Luffy | Chief Information Officer | 1960 |
| Mr. Ryan Ricketts | Director of Investor Relations & Financial Planning | — |
| Mr. K. Adam Pretty | General Counsel & Secretary | — |
| Ms. Kelly Clifford Riehl | Vice President of Communications and Community Relations | 1977 |
Fundamentals
Valuation
Profitability
Trading
Dividend
Source: third-party data provider, as of November 13, 2026
Technical indicators
- RSI 14
- 50.94
- MACD 12/26/9
- 5.34
- EMA 9 of MACD
- 4.36
- MACD histogram
- 0.98
- SMA 50
- $202.99
- Price above SMA 50
- EMA 50
- $208.76
- Price above EMA 50
- SMA 200
- $243.97
- Price below SMA 200
- EMA 200
- $238.53
- Price below EMA 200
Calculated by Gotrade from daily closing prices, as of November 11, 2026. Technical data, not a recommendation.
Analyst views
7 analyst ratings
Third-party analyst opinion, not a recommendation from Gotrade.
- Low
- $180.00
- Average
- $215.71
- High
- $257.00
Seasonality
Monthly price change (%)| Jan | Feb | Mar | Apr | May | Jun | Jul | Aug | Sep | Oct | Nov | Dec | |
|---|---|---|---|---|---|---|---|---|---|---|---|---|
| 2021 | -2.3 | +12.4 | ||||||||||
| 2022 | -17.7 | -13.2 | -15.7 | -6.3 | +16.2 | -11.6 | +15.9 | -11.0 | -8.9 | +1.2 | +2.6 | -2.6 |
| 2023 | +25.4 | +2.8 | -3.2 | +9.0 | -14.8 | +31.7 | +7.0 | -2.7 | -14.6 | -9.2 | +30.7 | +19.1 |
| 2024 | +7.9 | +19.0 | +6.9 | -8.4 | -11.9 | -2.9 | +14.8 | |||||
| 2026 | +1.8 | +13.9 | -0.5 | +6.3 | -18.0 | +10.7 | -3.6 |










