
NVR (NVR) Stock
Key stats
- Market cap
- $15.60B
- Price / Earnings ratio
- 15.3x
- EPS (TTM)
- $380.61
- Volume
- Loading
- 52-week high
- $8200.00
- 52-week low
- $5501.01
- EPS vs analyst estimate
- +1.9%Q3 FY25 · $112.33 vs $110.21
Source: third-party data provider, as of November 13, 2026
EPS estimate: analyst consensus
Compare with NVR
Recent news
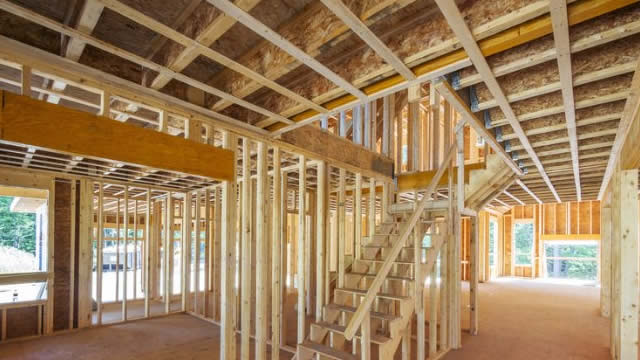
NVR Q3 Earnings Miss Estimates on Lower Settlements & Margin Pressure
NVR Q3 Earnings Miss Estimates on Lower Settlements & Margin Pressure
NVR
NVR (NVR) Q3 Earnings and Revenues Lag Estimates
NVR (NVR) Q3 Earnings and Revenues Lag Estimates
NVR
Earnings Preview: NVR (NVR) Q3 Earnings Expected to Decline
Earnings Preview: NVR (NVR) Q3 Earnings Expected to Decline
NVR
NetApp highlighted as Zacks Bull and NVR Bear of the Day
NetApp highlighted as Zacks Bull and NVR Bear of the Day
NVRNews tone: automated (AI) classification of the article's content, not a price prediction.
Technical indicators
- RSI 14
- 45.14
- MACD 12/26/9
- 29.99
- EMA 9 of MACD
- 18.77
- MACD histogram
- 11.22
- SMA 50
- $6,090.27
- Price below SMA 50
- EMA 50
- $6,106.19
- Price below EMA 50
- SMA 200
- $6,482.24
- Price below SMA 200
- EMA 200
- $6,529.88
- Price below EMA 200
Calculated by Gotrade from daily closing prices, as of November 11, 2026. Technical data, not a recommendation.
Analyst ratings
Analyst consensus: Sell
Based on 2 analyst ratings
Third-party analyst opinion, not a recommendation from Gotrade.
Financials
Performance
Debt & Balance Sheet
Revenue to Profit
2025Earnings
The market is expecting earnings per share of $93.26 for this quarter. The company has not yet shared when it is announcing earnings.
Source: third-party data provider
Latest news
NVR Q3 Earnings Miss Estimates on Lower Settlements & Margin Pressure
NVR Q3 Earnings Miss Estimates on Lower Settlements & Margin Pressure
NVRNVR (NVR) Q3 Earnings and Revenues Lag Estimates
NVR (NVR) Q3 Earnings and Revenues Lag Estimates
NVREarnings Preview: NVR (NVR) Q3 Earnings Expected to Decline
Earnings Preview: NVR (NVR) Q3 Earnings Expected to Decline
NVRNetApp highlighted as Zacks Bull and NVR Bear of the Day
NetApp highlighted as Zacks Bull and NVR Bear of the Day
NVR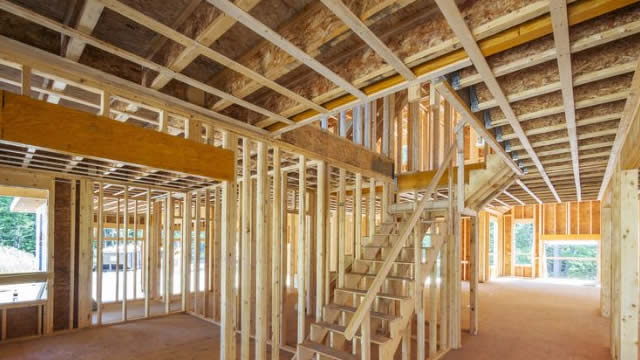
Mortgage Rates Are Keeping Buyers on the Sidelines. When They Finally Drop, Here Are 2 Homebuilder Stocks I'm Dying to Buy
Mortgage Rates Are Keeping Buyers on the Sidelines. When They Finally Drop, Here Are 2 Homebuilder Stocks I'm Dying to Buy
NVR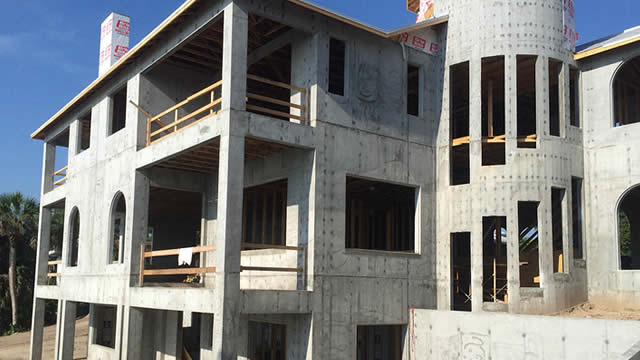
PSMMY or NVR: Which Is the Better Value Stock Right Now?
PSMMY or NVR: Which Is the Better Value Stock Right Now?
NVR
Berkshire Boosts Its Bet: This AI Hyperscaler Is Now a Top-3 Holding
Berkshire Boosts Its Bet: This AI Hyperscaler Is Now a Top-3 Holding
NVR
NVR Director George Oliver Buys $405K in Stock -- Should Investors Buy Too?
NVR Director George Oliver Buys $405K in Stock -- Should Investors Buy Too?
NVR
PHM or NVR: Which Is the Better Value Stock Right Now?
PHM or NVR: Which Is the Better Value Stock Right Now?
NVR
Is NVR Stock Attractive After Its 2026 Earnings & Revenue Miss?
Is NVR Stock Attractive After Its 2026 Earnings & Revenue Miss?
NVRNews tone: automated (AI) classification of the article's content, not a price prediction.
About NVR
NVR sells and constructs homes under the Ryan Homes, NVHomes and Heartland Homes brands. As a corporate entity, NVR provides sales and marketing support, vital human resource specialists, and an advanced information technology department, and also provides mortgage banking.
Key Executives
| Name | Title | Year Born |
|---|---|---|
| Mr. Eugene James Bredow | President & CEO | 1970 |
| Mr. Paul C. Saville | Executive Chairman of the Board | 1956 |
| Mr. Daniel David Malzahn | Senior VP, CFO & Treasurer | 1970 |
| Mr. Matthew B. Kelpy CPA | VP, Chief Accounting Officer & Controller | 1973 |
| Mr. James M. Sack | General Counsel & Secretary | — |
Fundamentals
Valuation
Profitability
Trading
Dividend
Source: third-party data provider, as of November 13, 2026
Technical indicators
- RSI 14
- 45.14
- MACD 12/26/9
- 29.99
- EMA 9 of MACD
- 18.77
- MACD histogram
- 11.22
- SMA 50
- $6,090.27
- Price below SMA 50
- EMA 50
- $6,106.19
- Price below EMA 50
- SMA 200
- $6,482.24
- Price below SMA 200
- EMA 200
- $6,529.88
- Price below EMA 200
Calculated by Gotrade from daily closing prices, as of November 11, 2026. Technical data, not a recommendation.
Analyst views
2 analyst ratings
Third-party analyst opinion, not a recommendation from Gotrade.
- Low
- $4,864.00
- Average
- $6,144.50
- High
- $7,425.00
Seasonality
Monthly price change (%)| Jan | Feb | Mar | Apr | May | Jun | Jul | Aug | Sep | Oct | Nov | Dec | |
|---|---|---|---|---|---|---|---|---|---|---|---|---|
| 2021 | -1.0 | +9.3 | ||||||||||
| 2022 | -7.5 | -7.6 | -9.0 | -3.4 | +0.4 | -8.7 | +5.4 | -6.3 | -3.1 | +2.5 | +9.2 | -2.7 |
| 2023 | +14.8 | -3.4 | +8.4 | +4.7 | -5.4 | +14.0 | +0.3 | +0.8 | -8.4 | -9.2 | +10.7 | +10.8 |
| 2024 | +1.5 | +5.7 | +5.4 | -7.3 | +3.0 | -0.5 | +15.0 | +7.2 | +8.4 | -7.5 | +1.1 | -10.9 |
| 2025 | +0.3 | -6.4 | +0.6 | -1.2 | +1.2 | +4.9 | -1.5 | +4.6 | -1.7 | -10.3 | +6.2 | -3.0 |
| 2026 | +4.9 | -2.6 | -11.1 | -5.2 | -0.8 | +11.3 | -7.5 | +1.8 | -1.9 | -2.7 | -5.9 |










