
Toll Brothers (TOL) Stock
Key stats
- Market cap
- $13.91B
- Price / Earnings ratio
- 11.7x
- EPS (TTM)
- $12.50
- Volume
- Loading
- 52-week high
- $168.36
- 52-week low
- $123.15
- Dividend yield
- 0.68%
- Dividend amount (latest)
- $0.26
- EPS vs analyst estimate
- +3.9%Q3 FY25 · $3.73 vs $3.59
Source: third-party data provider, as of November 13, 2026
EPS estimate: analyst consensus
Compare with TOL
Recent news
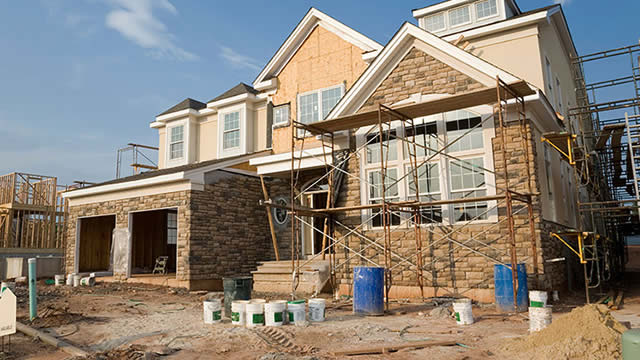
Toll Brothers (TOL) Stock Sinks As Market Gains: Here's Why
Toll Brothers (TOL) Stock Sinks As Market Gains: Here's Why
TOL
Wall Street Bulls Look Optimistic About Toll Brothers (TOL): Should You Buy?
Wall Street Bulls Look Optimistic About Toll Brothers (TOL): Should You Buy?
TOL
Here is What to Know Beyond Why Toll Brothers Inc. (TOL) is a Trending Stock
Here is What to Know Beyond Why Toll Brothers Inc. (TOL) is a Trending Stock
TOL
Why Toll Brothers (TOL) Outpaced the Stock Market Today
Why Toll Brothers (TOL) Outpaced the Stock Market Today
TOLNews tone: automated (AI) classification of the article's content, not a price prediction.
Technical indicators
- RSI 14
- 57.59
- MACD 12/26/9
- 4.61
- EMA 9 of MACD
- 3.77
- MACD histogram
- 0.84
- SMA 50
- $139.10
- Price above SMA 50
- EMA 50
- $143.00
- Price above EMA 50
- SMA 200
- $144.40
- Price above SMA 200
- EMA 200
- $142.49
- Price above EMA 200
Calculated by Gotrade from daily closing prices, as of November 11, 2026. Technical data, not a recommendation.
Analyst ratings
Analyst consensus: Buy
Based on 9 analyst ratings
Third-party analyst opinion, not a recommendation from Gotrade.
Financials
Performance
Debt & Balance Sheet
Revenue to Profit
2025Earnings
The market is expecting earnings per share of $3.52 for this quarter. The company has not yet shared when it is announcing earnings.
Source: third-party data provider
Latest news
Toll Brothers (TOL) Stock Sinks As Market Gains: Here's Why
Toll Brothers (TOL) Stock Sinks As Market Gains: Here's Why
TOLWall Street Bulls Look Optimistic About Toll Brothers (TOL): Should You Buy?
Wall Street Bulls Look Optimistic About Toll Brothers (TOL): Should You Buy?
TOLHere is What to Know Beyond Why Toll Brothers Inc. (TOL) is a Trending Stock
Here is What to Know Beyond Why Toll Brothers Inc. (TOL) is a Trending Stock
TOLWhy Toll Brothers (TOL) Outpaced the Stock Market Today
Why Toll Brothers (TOL) Outpaced the Stock Market Today
TOL
Is Trending Stock Toll Brothers Inc. (TOL) a Buy Now?
Is Trending Stock Toll Brothers Inc. (TOL) a Buy Now?
TOL
The Big 3: XLF, TOL, BABA
The Big 3: XLF, TOL, BABA
TOL
Rate-Resilient vs. Rate-Exposed: Why Homebuilder Stocks Are Diverging
Rate-Resilient vs. Rate-Exposed: Why Homebuilder Stocks Are Diverging
TOL
Toll Brothers Inc. (TOL) is Attracting Investor Attention: Here is What You Should Know
Toll Brothers Inc. (TOL) is Attracting Investor Attention: Here is What You Should Know
TOL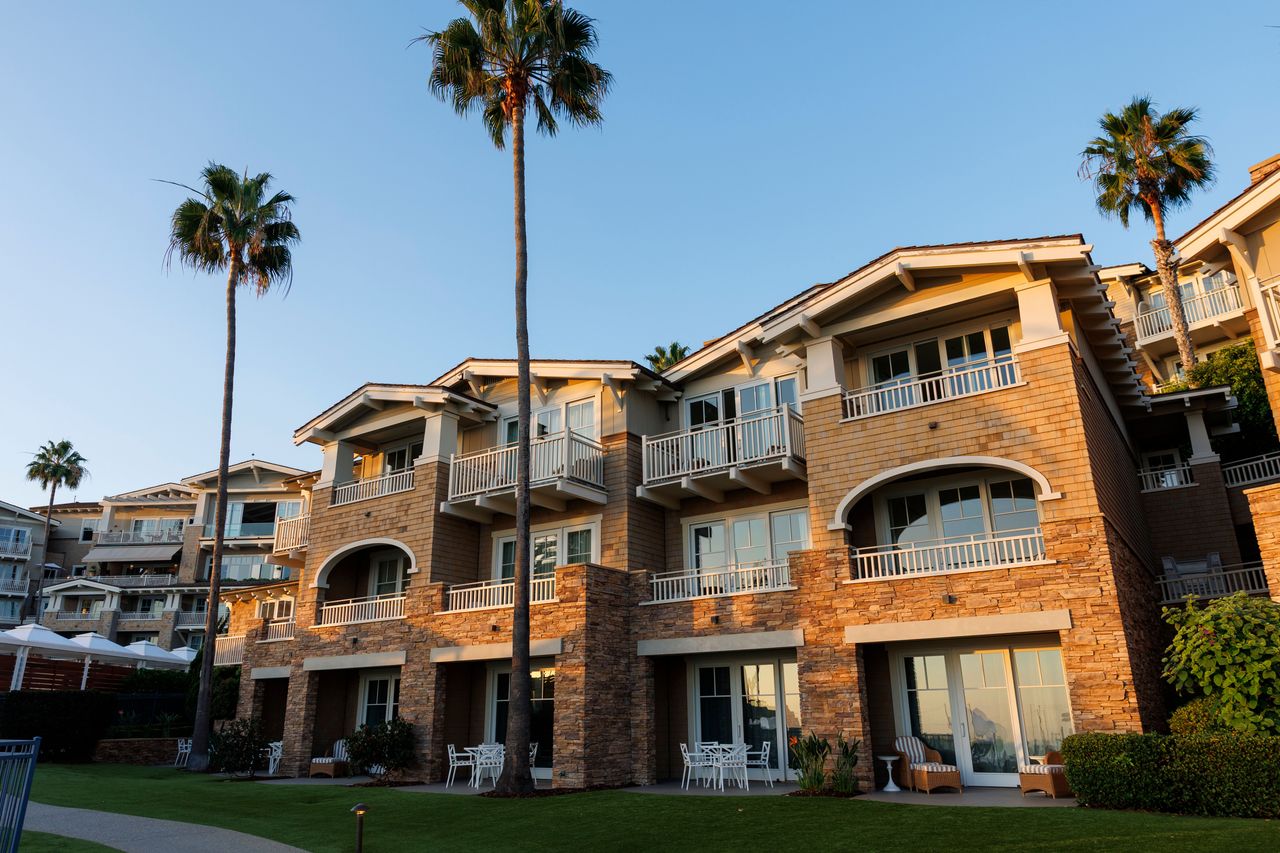
US Real Estate Stocks Hit All-Time Low Relative To S&P 500, Prompting Peter Schiff’s ‘Industry Is Dead’ Warning
US Real Estate Stocks Hit All-Time Low Relative To S&P 500, Prompting Peter Schiff’s ‘Industry Is Dead’ Warning
TOL
Toll Brothers Inc. (TOL) Is a Trending Stock: Facts to Know Before Betting on It
Toll Brothers Inc. (TOL) Is a Trending Stock: Facts to Know Before Betting on It
TOLNews tone: automated (AI) classification of the article's content, not a price prediction.
About Toll Brothers
Toll Brothers, an award-winning FORTUNE 500 company founded in 1967, is the nation's leading builder of luxury homes. Embracing an unwavering commitment to quality and customer service, Toll Brothers currently builds in 24 states nationwide. The Company serves first-time, move-up, empty-nester, active-adult, and second-home buyers, as well as urban and suburban renters.
Key Executives
| Name | Title | Year Born |
|---|---|---|
| Mr. Karl K. Mistry | CEO & Director | 1981 |
| Mr. Douglas C. Yearley Jr. | Executive Chairman | 1960 |
| Mr. Seth J. Ring | COO & President | 1981 |
| Mr. Gregg L. Ziegler | Executive VP & CFO | 1973 |
| Mr. Martin P. Connor CPA | Senior Advisor | 1964 |
| Ms. Erica J. Mainardi | SVP & Chief Accounting Officer | 1982 |
| Mr. John Critikos | Chief Information Officer & Senior VP | — |
| Mr. Timothy J. Hoban J.D. | Chief Compliance Officer, General Counsel & Senior VP | — |
| Ms. Wendy L. Marlett | Executive VP & Chief Marketing Officer | 1964 |
| Ms. Kellie Hall | Chief Human Resources Officer | — |
Fundamentals
Valuation
Profitability
Trading
Dividend
Source: third-party data provider, as of November 13, 2026
Technical indicators
- RSI 14
- 57.59
- MACD 12/26/9
- 4.61
- EMA 9 of MACD
- 3.77
- MACD histogram
- 0.84
- SMA 50
- $139.10
- Price above SMA 50
- EMA 50
- $143.00
- Price above EMA 50
- SMA 200
- $144.40
- Price above SMA 200
- EMA 200
- $142.49
- Price above EMA 200
Calculated by Gotrade from daily closing prices, as of November 11, 2026. Technical data, not a recommendation.
Analyst views
9 analyst ratings
Third-party analyst opinion, not a recommendation from Gotrade.
- Low
- $118.00
- Average
- $165.33
- High
- $195.00
Seasonality
Monthly price change (%)| Jan | Feb | Mar | Apr | May | Jun | Jul | Aug | Sep | Oct | Nov | Dec | |
|---|---|---|---|---|---|---|---|---|---|---|---|---|
| 2021 | -0.4 | +11.9 | ||||||||||
| 2022 | -16.0 | -8.3 | -12.4 | -3.2 | +7.4 | -10.6 | +4.5 | -11.7 | -3.8 | -1.4 | +9.5 | +3.2 |
| 2023 | +17.6 | -0.5 | +1.8 | +6.0 | +7.2 | +15.1 | +1.8 | +2.0 | -11.8 | -3.1 | +15.7 | +17.1 |
| 2024 | -1.4 | +13.5 | +10.6 | -7.0 | +1.8 | -4.0 | +27.0 | +4.1 | +10.4 | -5.4 | +12.7 | -23.2 |
| 2025 | +9.0 | -15.1 | -2.6 | -4.2 | +3.0 | +10.5 | +0.3 | +14.0 | -0.1 | -3.6 | +4.9 | -3.3 |
| 2026 | +6.6 | +8.1 | -11.5 | +3.9 | -0.9 | +19.1 | -7.3 | -4.7 | -3.9 | +7.0 | -1.5 |
Corporate actions
Upcoming
No upcoming corporate actions for TOL










